Frequently Asked Questions
From 2018 to 2022, HQI created and distributed quarterly Quality Transparency Dashboards (QTDs) in Excel format containing publicly available quality performance data for each California Hospital Association (CHA) acute care member hospital. The data included hospital scores and state/national benchmarks for over 90 quality measures sourced from the Centers for Medicare & Medicaid Services (CMS), the California Maternal Quality Care Collaborative (CMQCC) via Cal Hospital Compare, and the Department of Health Care Access and Information (HCAI). The QTDs highlighted five recommended quality outcome measures as a “Model Quality Dashboard” that HQI encouraged the hospitals to modify as desired and share publicly.
HQI provides coordination and support for improvement and harmonizes measures for patient safety and quality improvement activities for California Hospital Association, Hospital Council — Northern & Central California, Hospital Association of Southern California, and Hospital Association of San Diego & Imperial Counties. The organization builds reliable and sustainable measures to gauge California’s performance and identifies opportunities for focus and innovation.
HQI changed the way QTD quality data are provided to member hospitals in 2023. Instead of emailing Excel files quarterly to member hospitals, publicly available hospital quality performance data are now provided in a new “Quality Transparency Dashboards Report” built in the Hospital Quality Improvement Platform (HQIP).
Because the Quality Transparency Dashboards Report provides both current and historical CMS data for more quality measures and in a timelier manner than beforehand, distributing the QTD data in HQIP is more efficient and delivers superior quality data for our members to use in their transparency efforts.
The Hospital Quality Improvement Platform (HQIP) is HQI’s free online comparative quality analytics platform. If you do not have an HQIP account, want more information about HQIP, or would like to schedule a 30-minute Zoom demo, visit our HQIP information page or email the HQI Analytics Team at HQIAnalytics@HQInstitute.org.
This is a report in HQIP that allows hospital leaders and quality/patient safety teams to compare their hospital’s quality performance to state and national benchmarks across all publicly reported CMS Hospital Care Compare measures.
There is no requirement or expectation for hospitals to use the Model Quality Dashboard. Although the measures on the Model Quality Dashboard are recommended for reporting by HQI, the goal of the QTD effort is to encourage hospitals to be more transparent with the public about their quality of care using whatever quality measures they choose to publicly report.
Hospitals interested in updating the measures presented in the Model Quality Dashboard using the information presented in the HQIP report may do so by following these instructions.
The National Healthcare Safety Network (NHSN) calculates standardized infection ratios (SIR) only when the expected number of infections during the specified time interval is at least 1.0. Expected number of infections less than 1.0 yields “not available.”
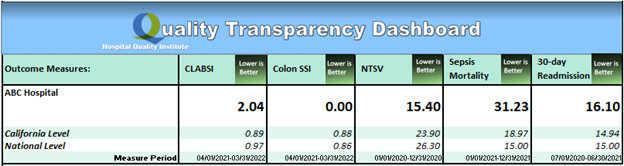
The quantitative measures in the Model Quality Dashboard include:
- CLABSI – Central Line-Associated Blood Stream Infection
- Colon SSI – Colon Surgical Site Infection
- NTSV – Nulliparous, Term, Singleton, Vertex Cesarean Birth Rate
- Sepsis Mortality – In-hospital mortality among acute inpatients with sepsis
- Hospital-wide All-Cause 30-day Unplanned Readmission Rate
The program measures in the Model Quality Dashboard include:
- Maternity Safety Program
- Sepsis Protocol
- Respiratory Monitoring Program
Subject matter experts, in conjunction with HQI and Patient Safety Movement Foundation representatives, selected these measures from available data that hospitals report to other government and non-government organizations.
The Quality Transparency Dashboards Report includes all historical and current CMS measure data in the Hospital Provider Data Catalog that California hospitals submitted for three inpatient quality reporting programs (Hospital Inpatient Quality Reporting (IQR) Program, Hospital-Acquired Condition (HAC) Reduction Program, and Hospital Readmissions Reduction Program (HRRP)), the Hospital Outpatient Quality Reporting (OQR) Program, and the Inpatient Psychiatric Facility Quality Reporting (IPFQR) Program.
The data sources for the outcome measures shown in the Model Quality Dashboard are:
- CLABSI and Colon SSI data come from CMS Hospital Compare HAI files
- NTSV C-section rates come from CMQCC via Cal Hospital Compare
- Hospital-wide All-Cause 30-day Unplanned Readmission Rate comes from CMS Hospital Compare Unplanned Hospital Visits files
- Sepsis Mortality rate is calculated by HQI from Department of Health Care Access and Information (HCAI) inpatient discharge files
Please visit the Quality Transparency Dashboard Sepsis Mortality Calculation page.
The diversity of claims-based, chart-abstracted, electronic health record (EHR)-based, survey-based, and surveillance-based measures available in the Quality Transparency Dashboards Report for hospitals to evaluate their quality of care is shown in the table below. Hospitals can also export spreadsheets of all their historical CMS data, along with state and national benchmarks for the measures.
| Measure Sets | Measures |
|---|---|
| Timely & Effective Care | Follow-up Care and Outcomes Emergency Department Care Healthcare Personnel Vaccination Safe Opioid Use Treatment Processes and Practices Use of Medical Imaging |
| Maternal Health | Elective Delivery Breast Milk Feeding |
| Complications & Deaths | Mortality Rates Complications Rates Serious Complications Healthcare-Associated Infections |
| Unplanned Hospital Visits | Rates of Readmission Outpatient Hospital Visits Hospital Return Days |
| Survey of Patient Experience (HCAHPS) | Composite Measures Individual Questions Linear Scores Star Ratings |
| Psychiatric Unit Services | Preventive Care and Screening Substance Use Treatment Patient Safety Follow-up Care |
Many hospitals have a web development team, while others may lack such resources. Each hospital may modify the format and appearance of the information in the Model Quality Dashboard or choose other measures to suit its needs. The simplest approach might be to capture the Model Quality Dashboard and post it as a graphic image. Other approaches may involve reformatting the information for display in a web browser.
California hospitals are encouraged to continually publish and update the Model Quality Dashboard or other measures from the Quality Transparency Dashboards Report on their public-facing websites to increase hospital quality transparency.
The Quality Transparency Dashboards Report data will be updated quarterly in January, April, July, and October when the measures are refreshed by CMS according to the update frequency schedule.
Quality Transparency Dashboards Report data are specific to each hospital. Hospitals also have an opportunity to provide comments on the Model Quality Dashboard describing their continuous improvement to patient safety and quality of care.
All hospitals that share a CMS Certification Number (CCN) are presented combined in the Quality Transparency Dashboard Report because this how the data are provided on the CMS Hospital Care Compare website. In contrast, NTSV and Sepsis Mortality are available separately if the hospitals report to CMQCC or HCAI under separate HCAI ID numbers.
Hospitals may modify the Model Quality Dashboard as they wish. HQI encourages hospitals to address the minimum data and content, with the local option of adding content such as other measures or more timely data.
Contact the HQI Analytics Team at HQIAnalytics@hqinstitute.org for some examples.
The five outcome measures and the three program measures are a minimum recommended measure set. Hospitals are encouraged to display additional measures.
Follow the instructions to update the measures presented in the Model Quality Dashboard. Check the program status boxes, add comments if needed, save as pdf, and post the pdf on your website.
Some hospitals already present quality data or links to external quality data on their websites, which is consistent with the goal of improving hospital transparency about quality measures. The Model Quality Dashboard is intended to be an easy way for other hospitals to join in the transparency effort. HQI encourages hospitals to share data on their own websites as the preferred method, either using the provided dashboards or their own presentation, as this is much more convenient and transparent for the health consumer and community.
- Belong to the California Maternal Quality Care Collaborative (CMQCC), Alliance for Innovation on Maternal Health (AIM) Program, or other similar organizations
- Post-partum hemorrhage bundles
- Preeclampsia bundles
- Efforts to reduce early elective deliveries
- Efforts to lower rate of nulliparous, term, single, vertex, (NTSV) – cesarean births
- Guidelines to prevent maternal venous thromboembolism
- Emergency response preparedness
- Respiratory monitoring is an integral component of care across patient care environments
- Assessment/evaluation of pre-surgical patient for risk of respiratory compromise and ASA assignment, and appropriate triage for surgery
- Assessment of patients for OSA using STOPBANG or other standardized tool
- Use of pulse oximetry or other monitor device for patients at risk for respiratory decline or compromise
- Safe opioid prescribing practices
- Rapid response team
In addition, the Patient Safety Movement Foundation (PSMF) addresses opioid safety related respiratory monitoring.
- Use of sepsis clinical treatment protocols from a nationally or internationally recognized healthcare safety organization such as the Surviving Sepsis Campaign
- Education for early identification of sepsis, including the emergency department workforce
- Rapid treatment and monitoring of patient with sepsis, using sepsis bundle or protocol
- Champion or coordinator monitoring time to diagnosis, treatment, and adherence to guidelines
Contact the HQI Analytics Team at HQIAnalytics@hqinstitute.org